Consumer Risk Index 2025
An honest portfolio piece
Consumer Risk Index is a portfolio piece, and I want to be honest about that up front. It is not something anyone relies on, but it is a clear way for me to show what I can do with Python, data, FastAPI, and API integration. I built it around a question I genuinely found interesting: can you measure how financially stressed the average consumer is using only public data?
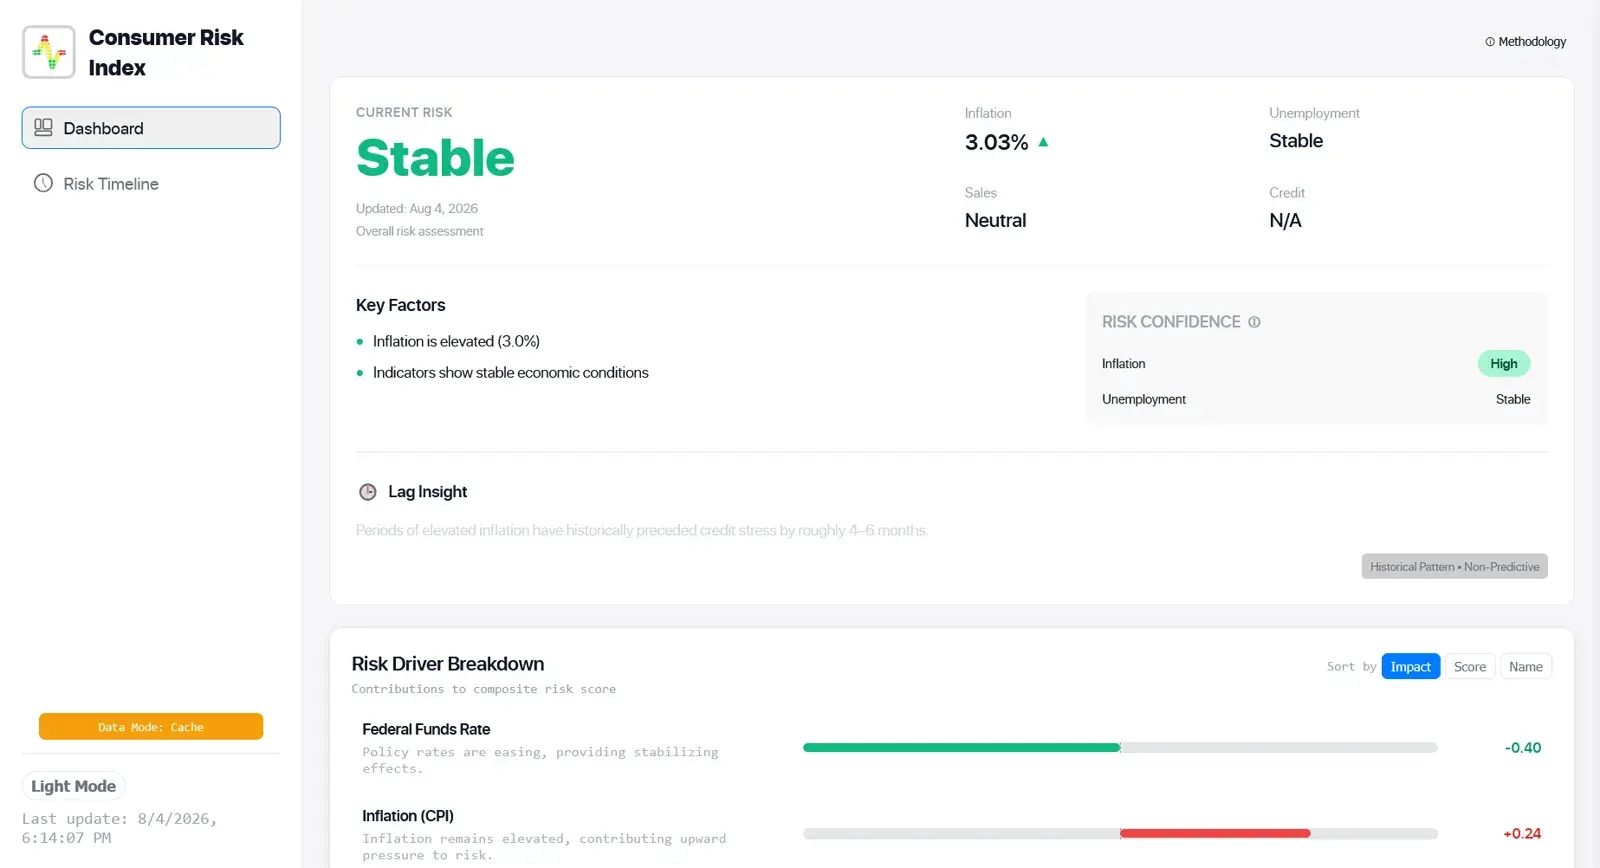
The project runs on five monthly indicators from FRED, the Federal Reserve's economic database: inflation, consumer credit, the federal funds rate, retail sales, and unemployment. The pipeline brings them onto a common monthly cadence, fills the gaps, and normalizes the values so they can be compared fairly. Each indicator contributes to one risk score based on its direction and rate of change, while fixed thresholds sort the result into Stable, Watch, or High Risk.
When the present resembles the past
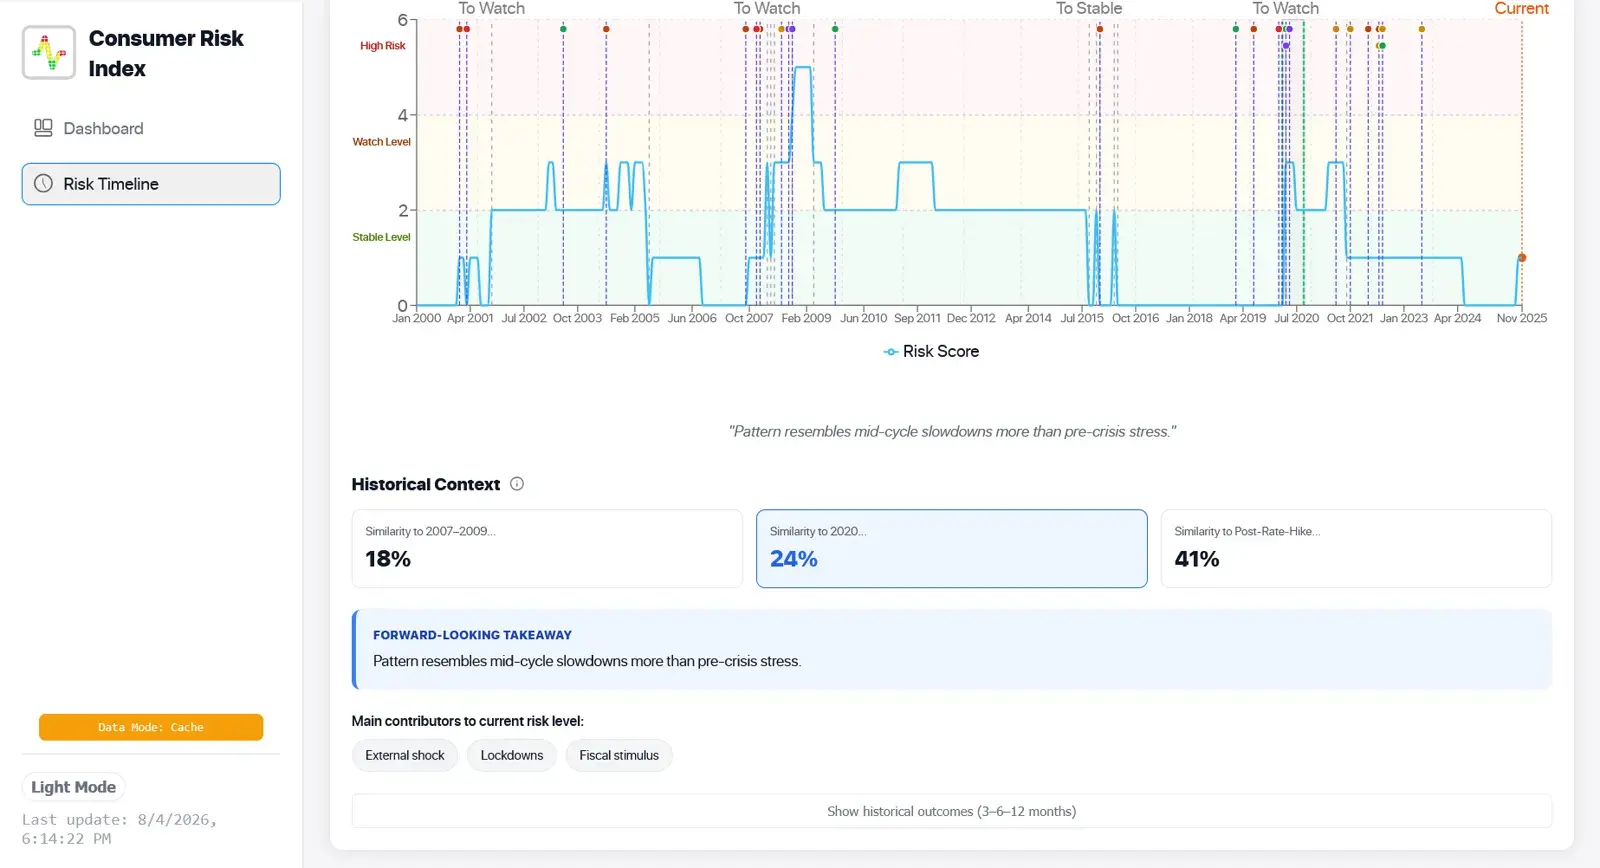
The part I like most is the historical comparison. The dashboard takes the current mix of indicators, measures how closely it resembles past periods such as the 2008 financial crisis, the 2020 COVID shock, or the recent rate-hike cycle, and explains which period today looks most like. It is descriptive rather than predictive, so it cannot tell you what happens next. It can tell you what the present rhymes with.
Learning to ship the whole thing
I built the whole system myself. The backend is an async FastAPI service that talks to the FRED API and caches what it pulls into TimescaleDB, while the frontend uses React with Recharts. I handled the data work, API integration, security, and Railway deployment, which is the part that matters most to me. This was where I stopped thinking of myself as someone who could handle one layer and started seeing myself as someone who could ship the whole thing.
Why it changed my direction
CRI is where I locked in on data. Analytics was my plan coming out of school, and I still love digging into a dataset, but building this taught me that I enjoy the feedback loop of full-stack work even more: seeing something run, breaking it, fixing it, and finally shipping it. This project sits at a fork in my story. It proves I can do data, while also explaining why I started leaning into everything around it. In a lot of ways, this is where portfolio-maxxing started for me.